github 주소 : github.com/sangHa0411/DataScience/blob/main/Amazon_BestSellers_Seaborn.ipynb
sangHa0411/DataScience
Contribute to sangHa0411/DataScience development by creating an account on GitHub.
github.com
저번 포스팅에서는 matplotlib을 이용해서 데이터를 시각화를 해보았습니다.
이번 포스팅에서는 seaborn을 이용해서 데이터를 시각화해볼 것이며 어떻게 이용하는지 그리고 matplotlib과 비교해서 어떠한 점이 좋은지 정리해보도록 하겠습니다.
matplotlib 포스팅 주소 : electronicprogrammers.com/70?category=904280
Python - Matplotlib을 이용하는 방법
github 주소 : github.com/sangHa0411/DataScience/blob/main/Amazon_BestSellers_Matplotlib.ipynb sangHa0411/DataScience Contribute to sangHa0411/DataScience development by creating an account on GitHub..
electronicprogrammers.com
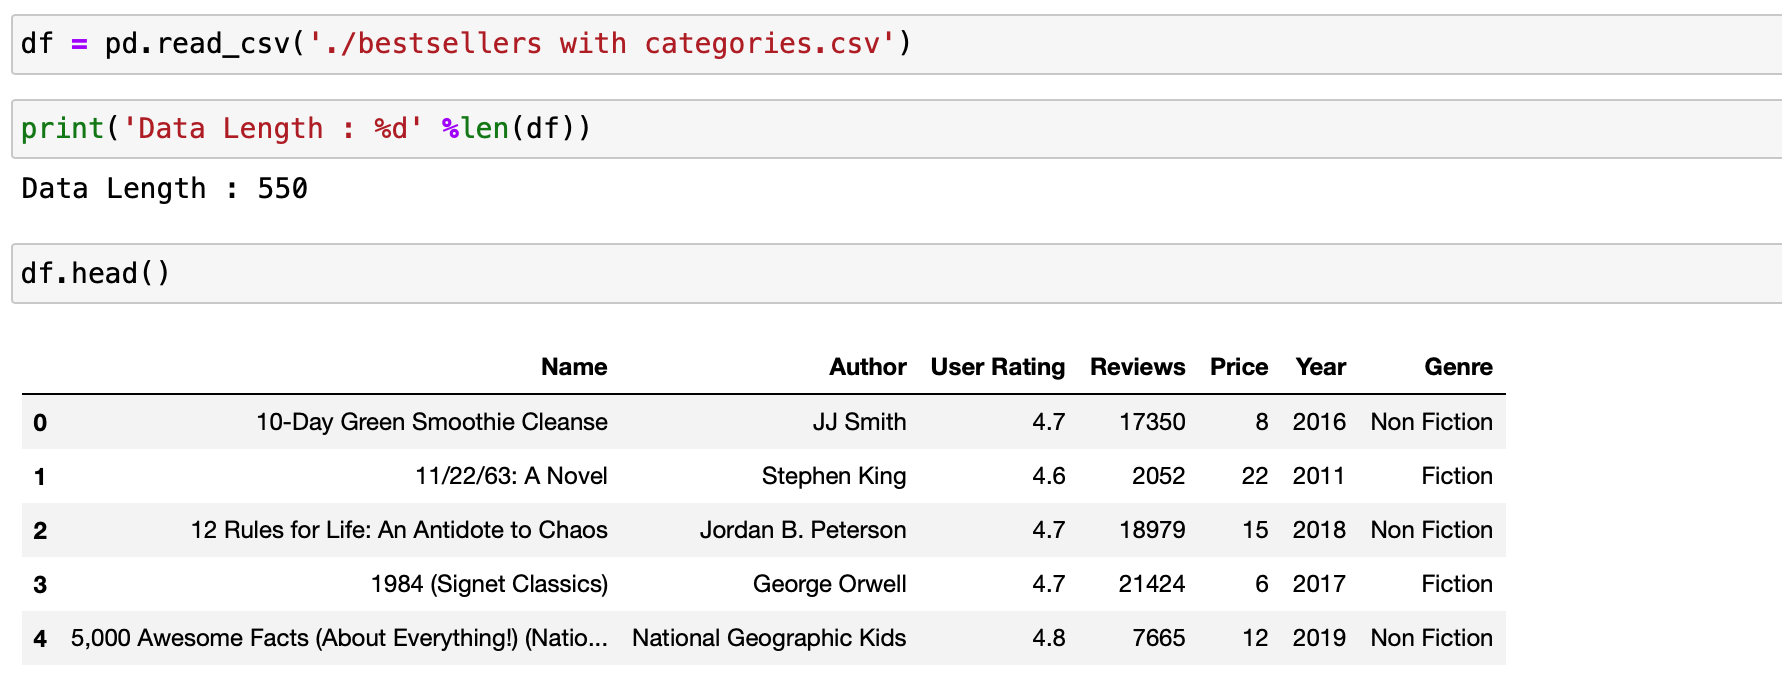
비교를 위해서 같은 데이터를 이용하도록 하겠습니다. 먼저 데이터를 Pandas를 이용해서 데이터를 불러오겠습니다.
1. 막대 그래프
plt.figure(figsize = (15 , 7))

plt.title('Top 10 Bestsellers Authors' ,fontsize = 20)

sns.countplot(data = sub_df ,
              x = 'Author' ,
              palette = 'Blues')

plt.xlabel('Author' , fontsize = 15)
plt.ylabel('Counts' , fontsize = 15)

plt.xticks(rotation = -45)

plt.show()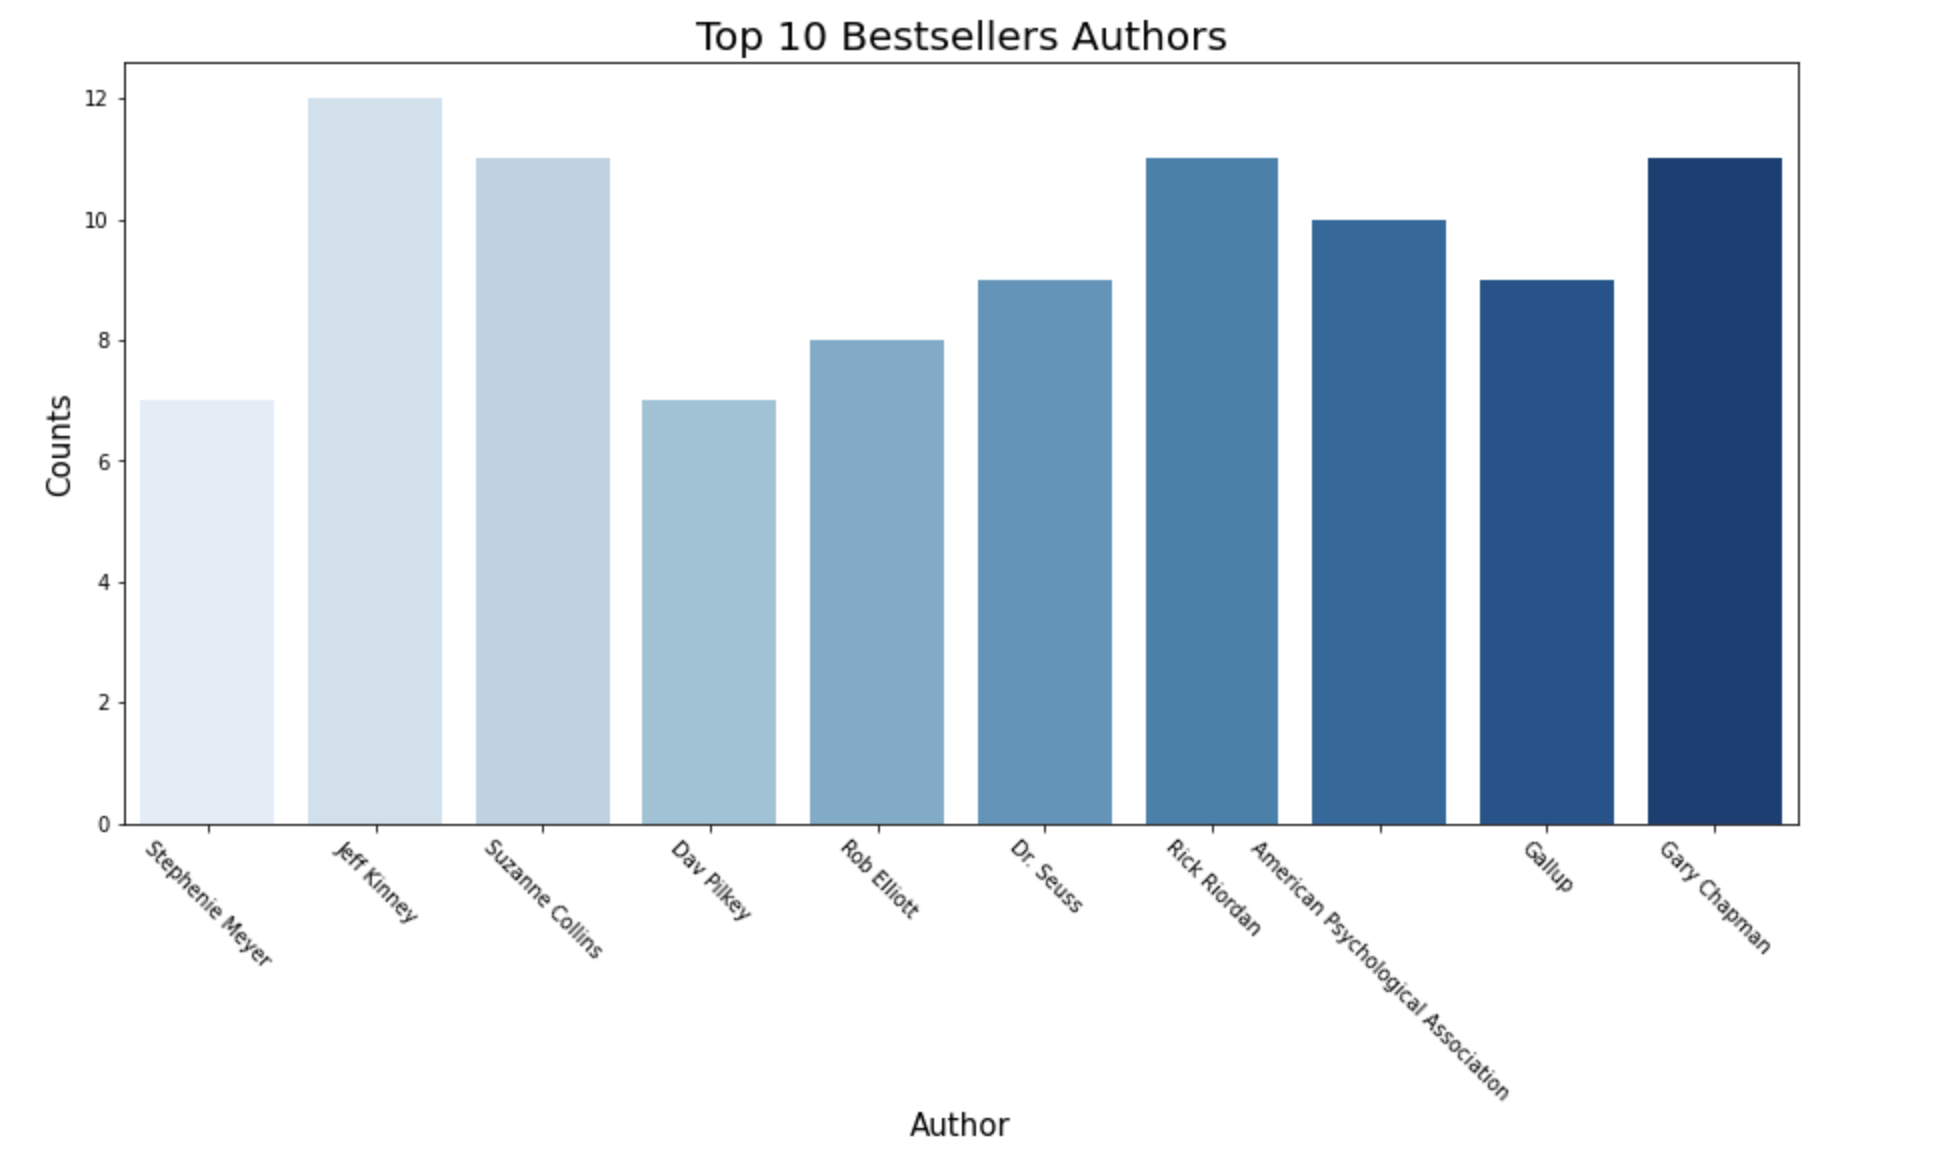
sns.countplot()함수를 이용해서 이산적인 속성에 대해서 갯수가 얼마나 있는지를 파악하고 나서 이 수치를 기반으로 막대그래프를 그리는 함수입니다.
matplotlib을 이용할 때와는 다르게 pandas 데이터와 속성의 이름을 인자로 입력하면 됩니다.
plt.figure(figsize = (15 , 7))

plt.title('Top 10 Bestsellers Authors' ,fontsize = 20)

sns.countplot(data = sub_df ,
              x = 'Author' ,
              hue = 'Genre' ,
              palette = 'RdBu')

plt.xlabel('Author' , fontsize = 15)
plt.ylabel('Counts' , fontsize = 15)

plt.xticks(rotation = -45)

plt.show()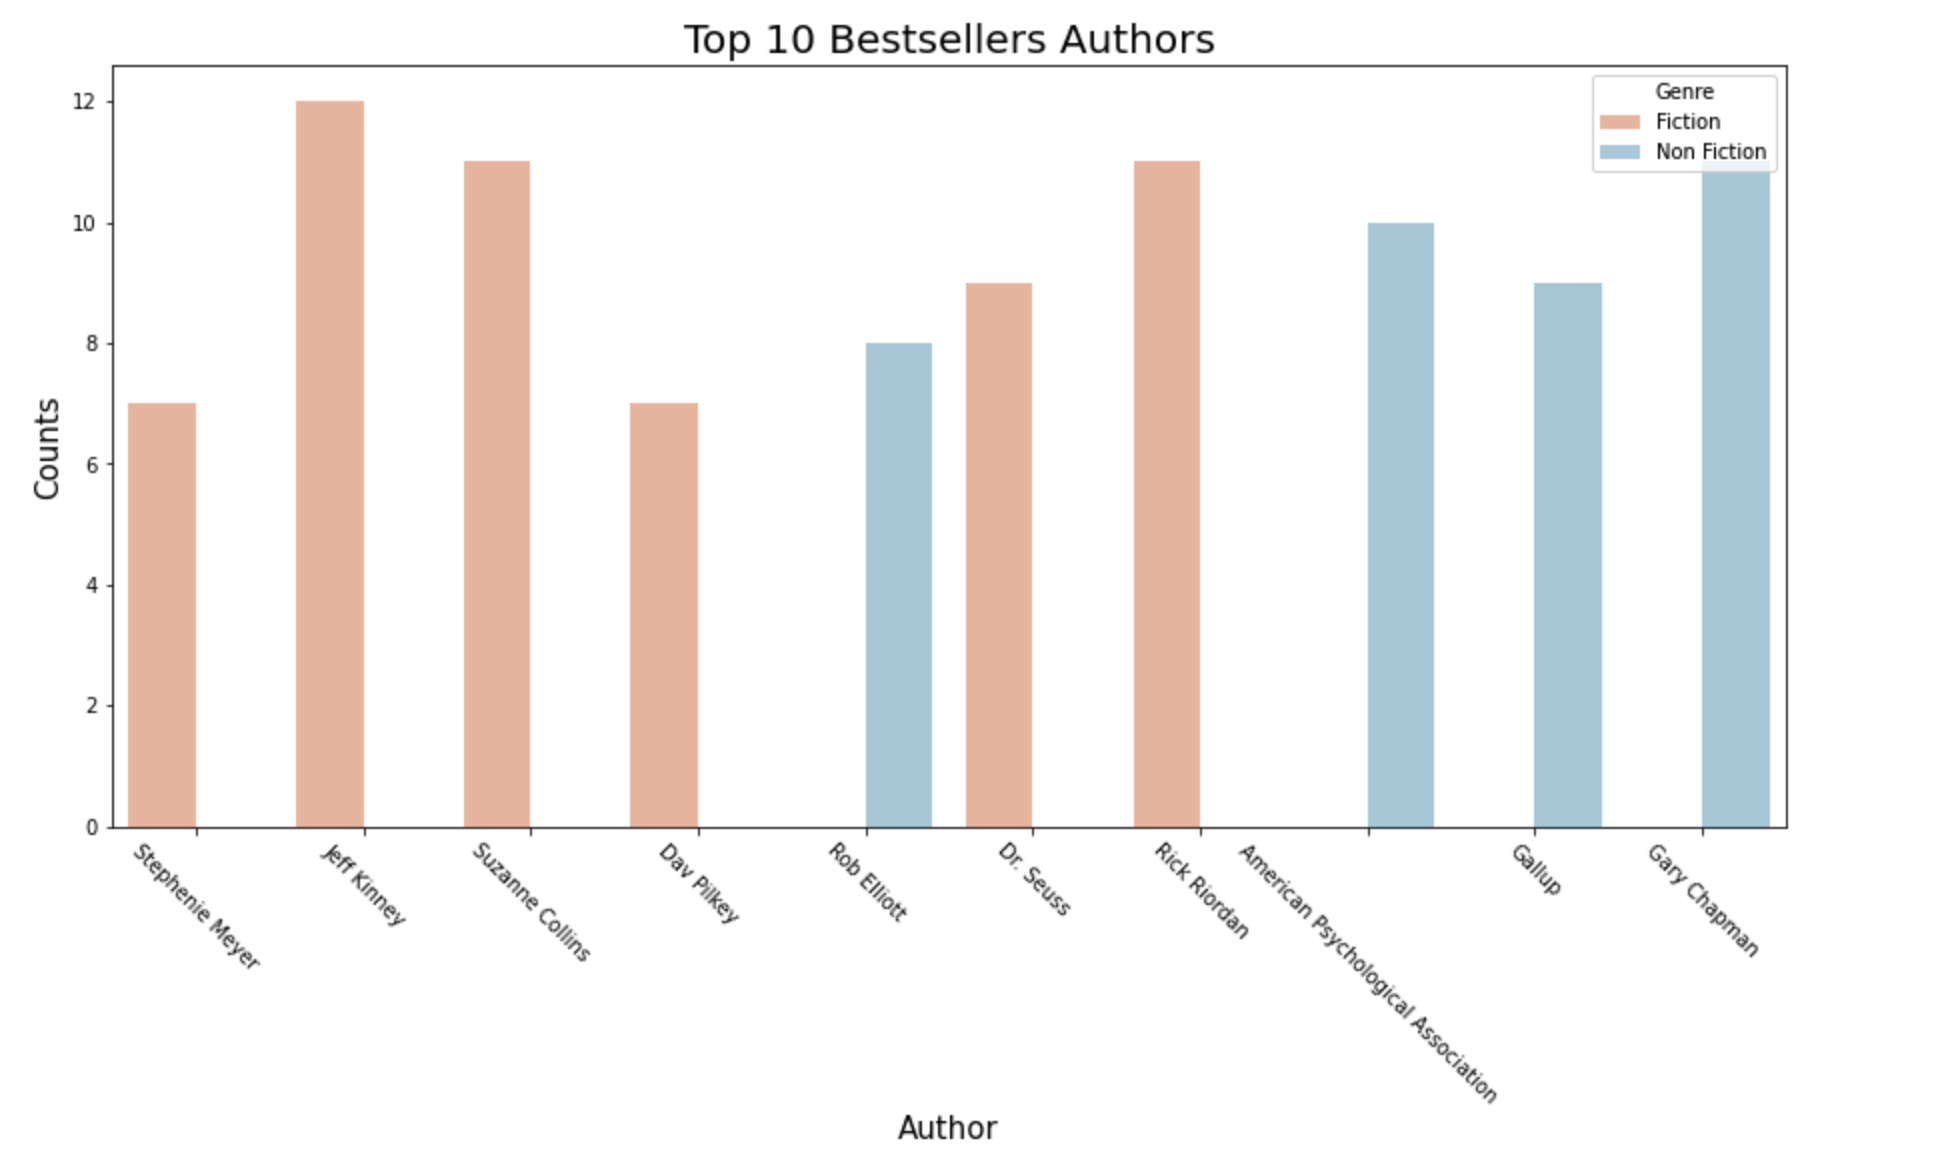
sns.countplot 인자에 hue 인자로 Genre를 입력함으로써 알아서 Genre를 구분해서 갯수를 파악하고 나서 막대그래프를 그려줍니다.
위 그래프를 통해서 데이터 상에는 Fiction 과 Non Fiction 두 종류를 같이 쓴 작가는 없다라는 것을 확인할 수 있습니다.
2. 히스토그램
plt.figure(figsize = (15 , 8))

plt.title('User Rating Histogram' , fontsize = 20)

sns.histplot(data = df ,
             x = 'User Rating' ,
             hue = 'Genre' ,
             alpha = 0.5 ,
             multiple= 'dodge' ,
             palette = 'RdBu' ,
             bins = 50)

plt.xlabel('User Rating' , fontsize = 15)
plt.ylabel('Count' , fontsize = 15)


plt.show()
sns.histplot 함수를 이용해서 히스토그램을 그릴 수 있으며 입력하는 것은 sns.countplot과 같습니다. Pandas의 데이터프레임 그리고 속성 이름 그리고 비교하고자 하는 것이 있다면 이는 hue 인자로 정해주면 됩니다.
multiple = dodge로 정함으로써 쌓아서 그리는 것이 아니라 옆에 그림으로써 Non Fiction , 그리고 Fiction 장르의 평점 히스토그램을 비교해서 보기 편하게 하였습니다.
3. 커널 밀도 함수
plt.figure(figsize = (15 , 8))

plt.title('Review Kernel Density plot' , fontsize = 20)

sns.kdeplot(data = df ,
            x = 'Reviews' ,
            hue = 'Genre' ,
            fill = True ,
            alpha = 0.2)

plt.xlabel('Reviews' , fontsize = 15)
plt.ylabel('Density' , fontsize = 15)


plt.show()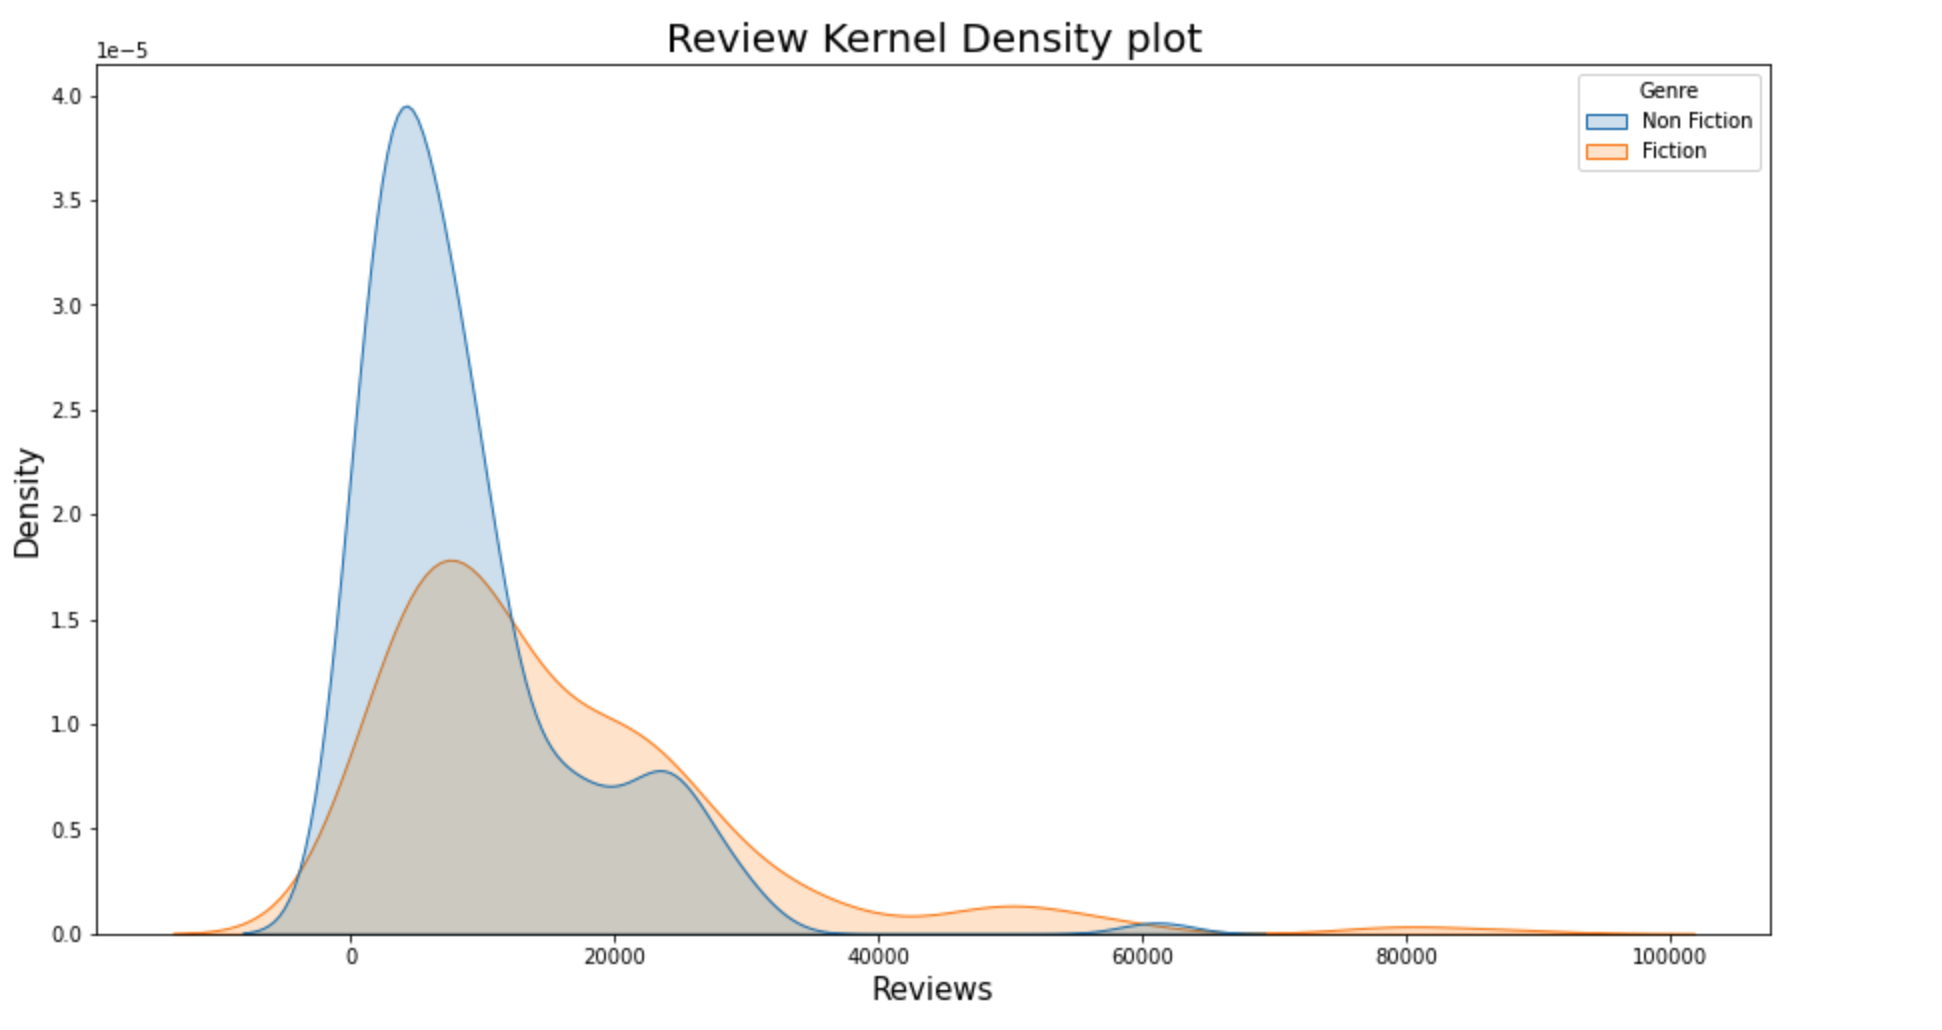
히스토그램과 비슷한 성격을 가지면서 Review를 기준으로 커널 밀도 함수를 그려보았습니다. 보면 Non Fiction의 경우 Review가 Fiction의 경우보다 적은 것의 밀도가 더 높으므로 전체적으로 Review의 수가 Fiction의 비해 적다라는 것을 확인할 수 있습니다.
4. Box Plot
plt.figure(figsize = (15 , 8))

plt.title('Year & Reviews BoxPlot' , fontsize = 20)

sns.boxplot(data = df , x = 'Year' , y = 'Reviews' , palette = 'Greens')

plt.xlabel('Year' , fontsize = 15)
plt.ylabel('Reviews' , fontsize = 15)

plt.show()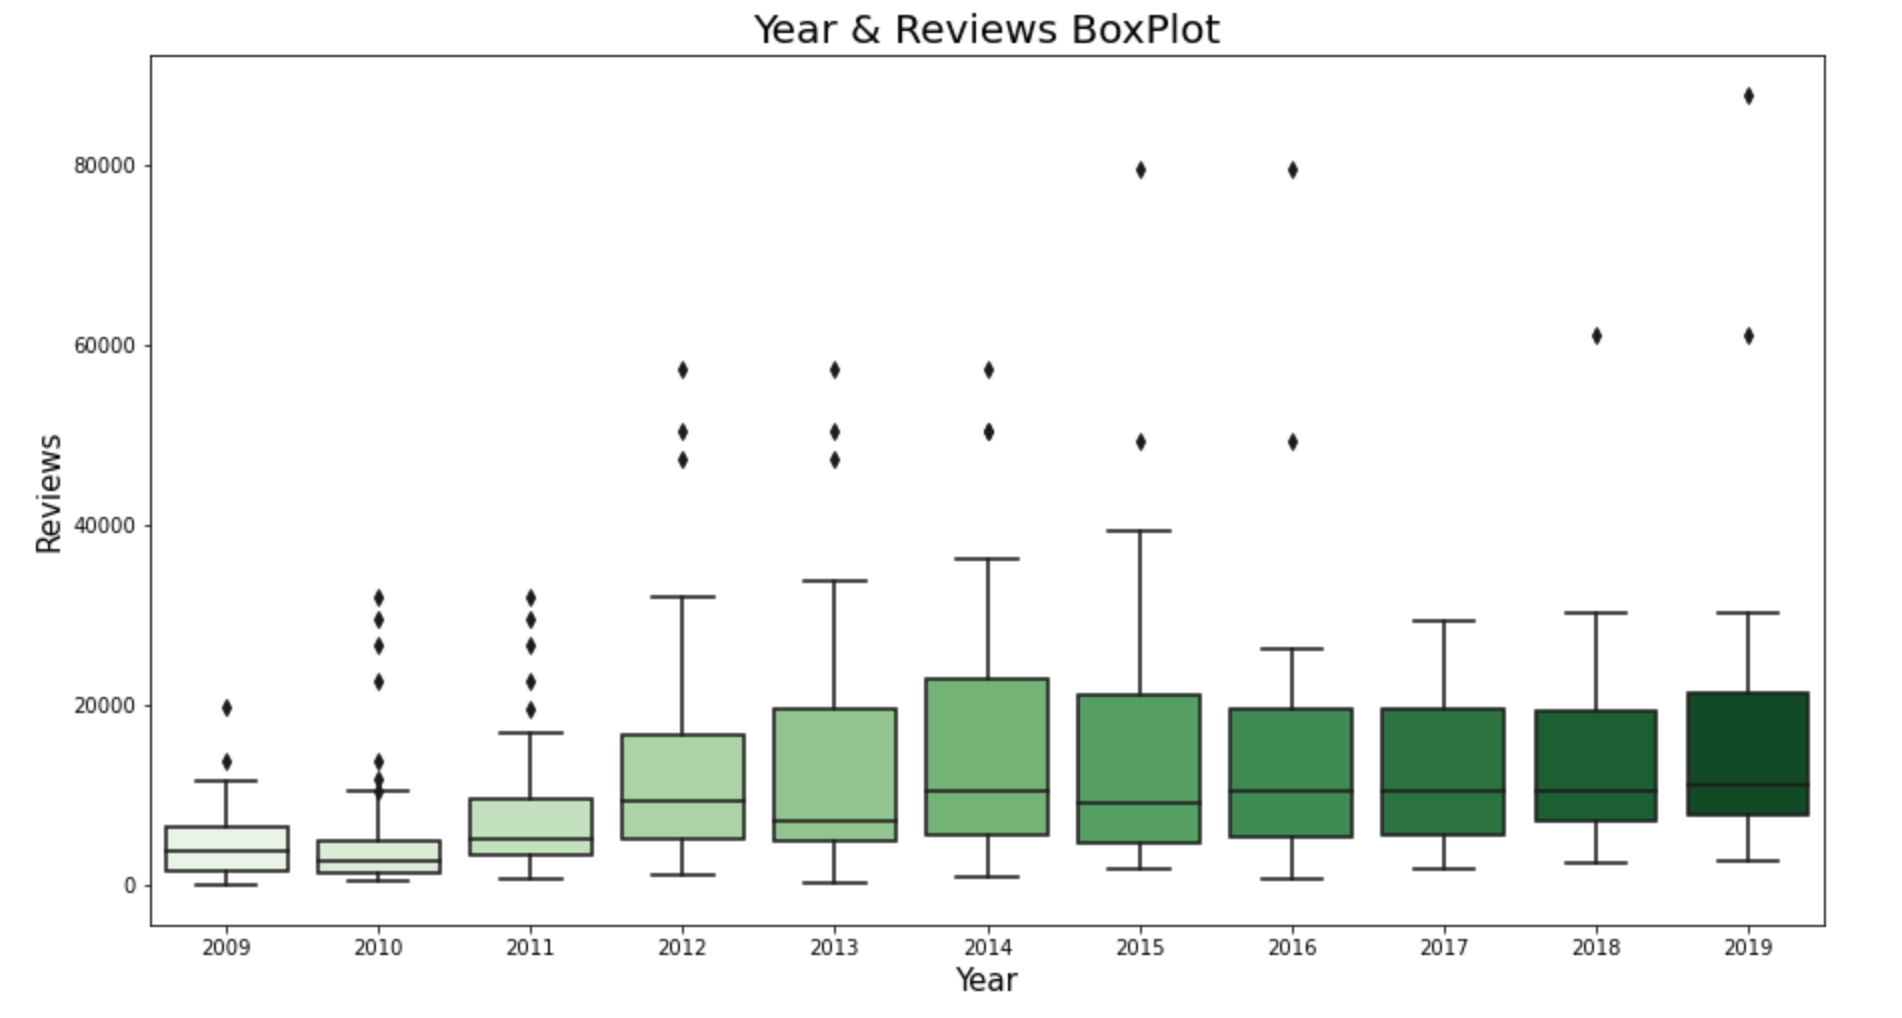
Box Plot 과 같은 경우에는 Pandas 내에서 x , y 두가지 속성을 입력해주어야 하는데 x는 이산적인 속성 , y는 연속적인 속성을 입력함으로써 각 이산적인 속성에 대해 구분지어서 Box Plot 을 그립니다.
이는 아래의 한 문장으로 구현이 가능하며 2차원 배열을 만들어야 하는 matplotlib과는 다르게 확실히 편하다라는 것을 확인할 수 있습니다.
sns.boxplot(data = df , x = 'Year' , y = 'Reviews' , palette = 'Greens')
5. 2차원 커널 밀도 함수
plt.figure(figsize = (15 , 7))

plt.title('Price & Reviews 2D Kernel Density Plot' , fontsize = 20)

sns.kdeplot(x = 'Price' ,
            y = 'Reviews' ,
            data = df ,
            fill = True ,
            alpha = 0.5 ,
            color = 'Red')

plt.xlabel('Price' , fontsize = 15)
plt.ylabel('Reviews' , fontsize = 15)


plt.show()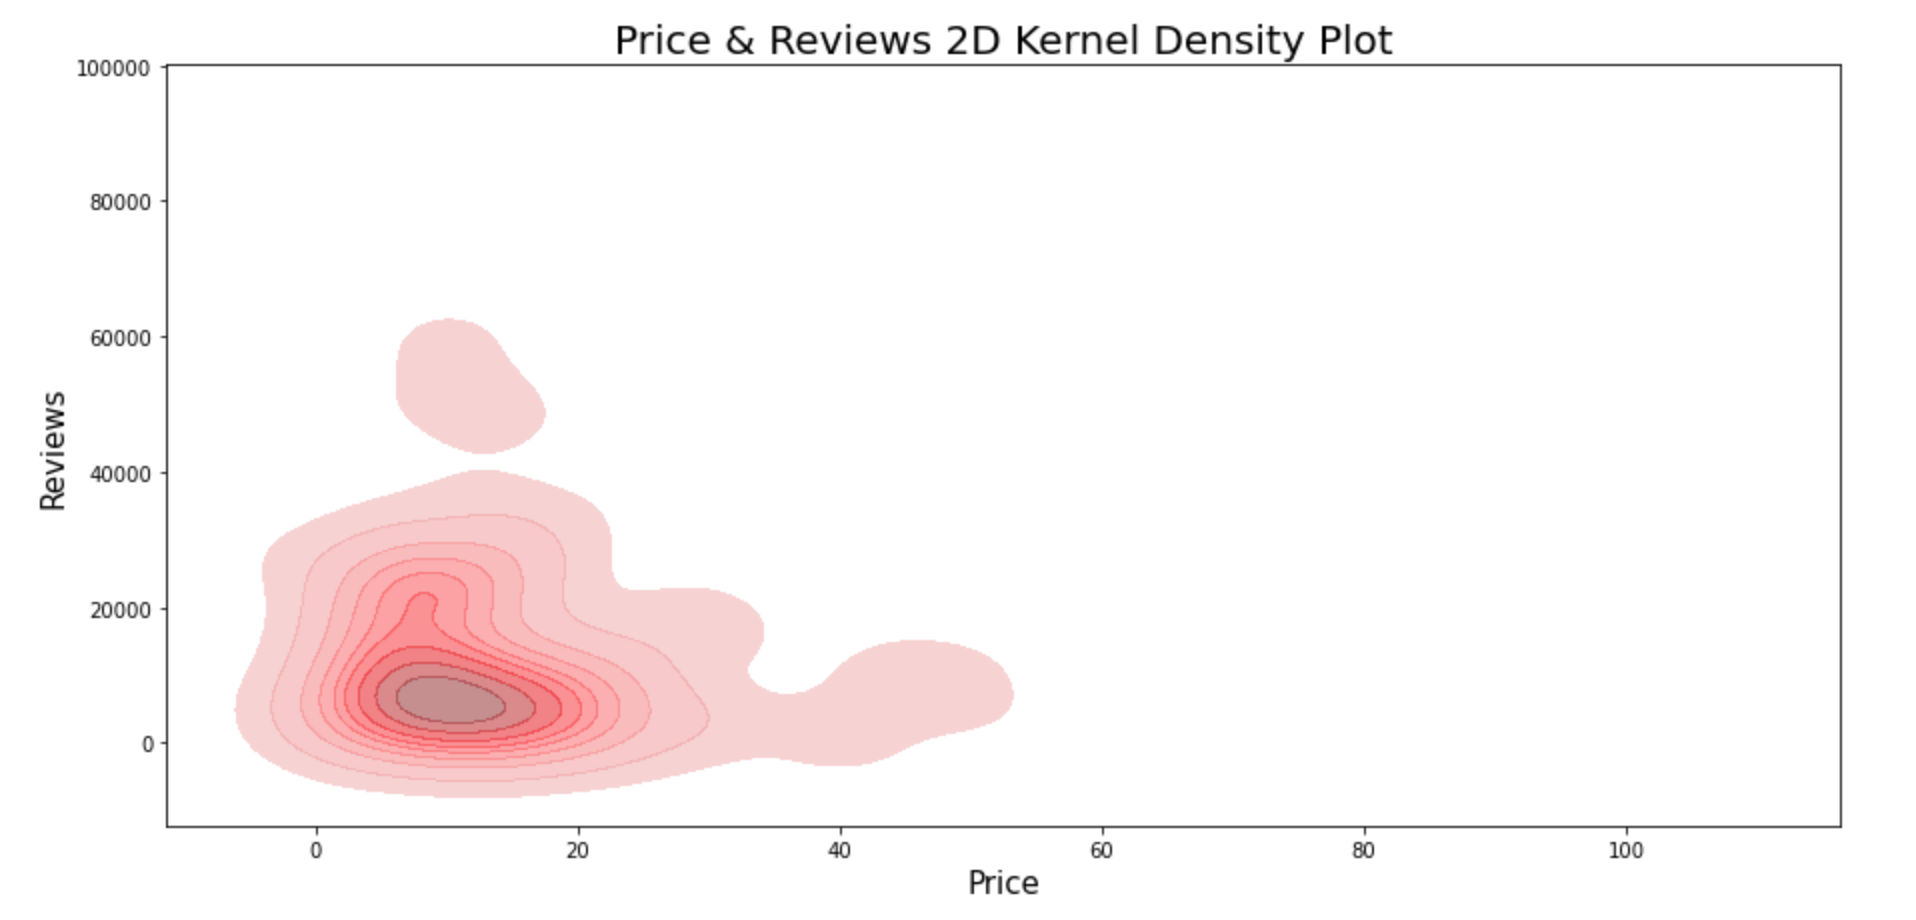
Box Plot 함수와는 다르게 x, y 모두 연속적인 속성을 입력하였고 밀도가 높을 수록 색이 진한 것을 확인할 수 있습니다. 따라서 위 함수로는 책이 주로 가격이 15 정도 , Review가 10000 인 것이 주를 이룬다고 할 수 있습니다.
6. Scatter plot
plt.figure(figsize = (15 , 7))

plt.title('Reviews , Price Graph Scatter plot' , fontsize = 20)

sns.scatterplot(data=df ,
                x='Price',
                y='Reviews' ,
                size = 'User Rating' ,
                hue = 'Genre' ,
                alpha = 0.5)

plt.xlabel('Price' , fontsize = 15)
plt.ylabel('Reviews' , fontsize = 15)

plt.show()
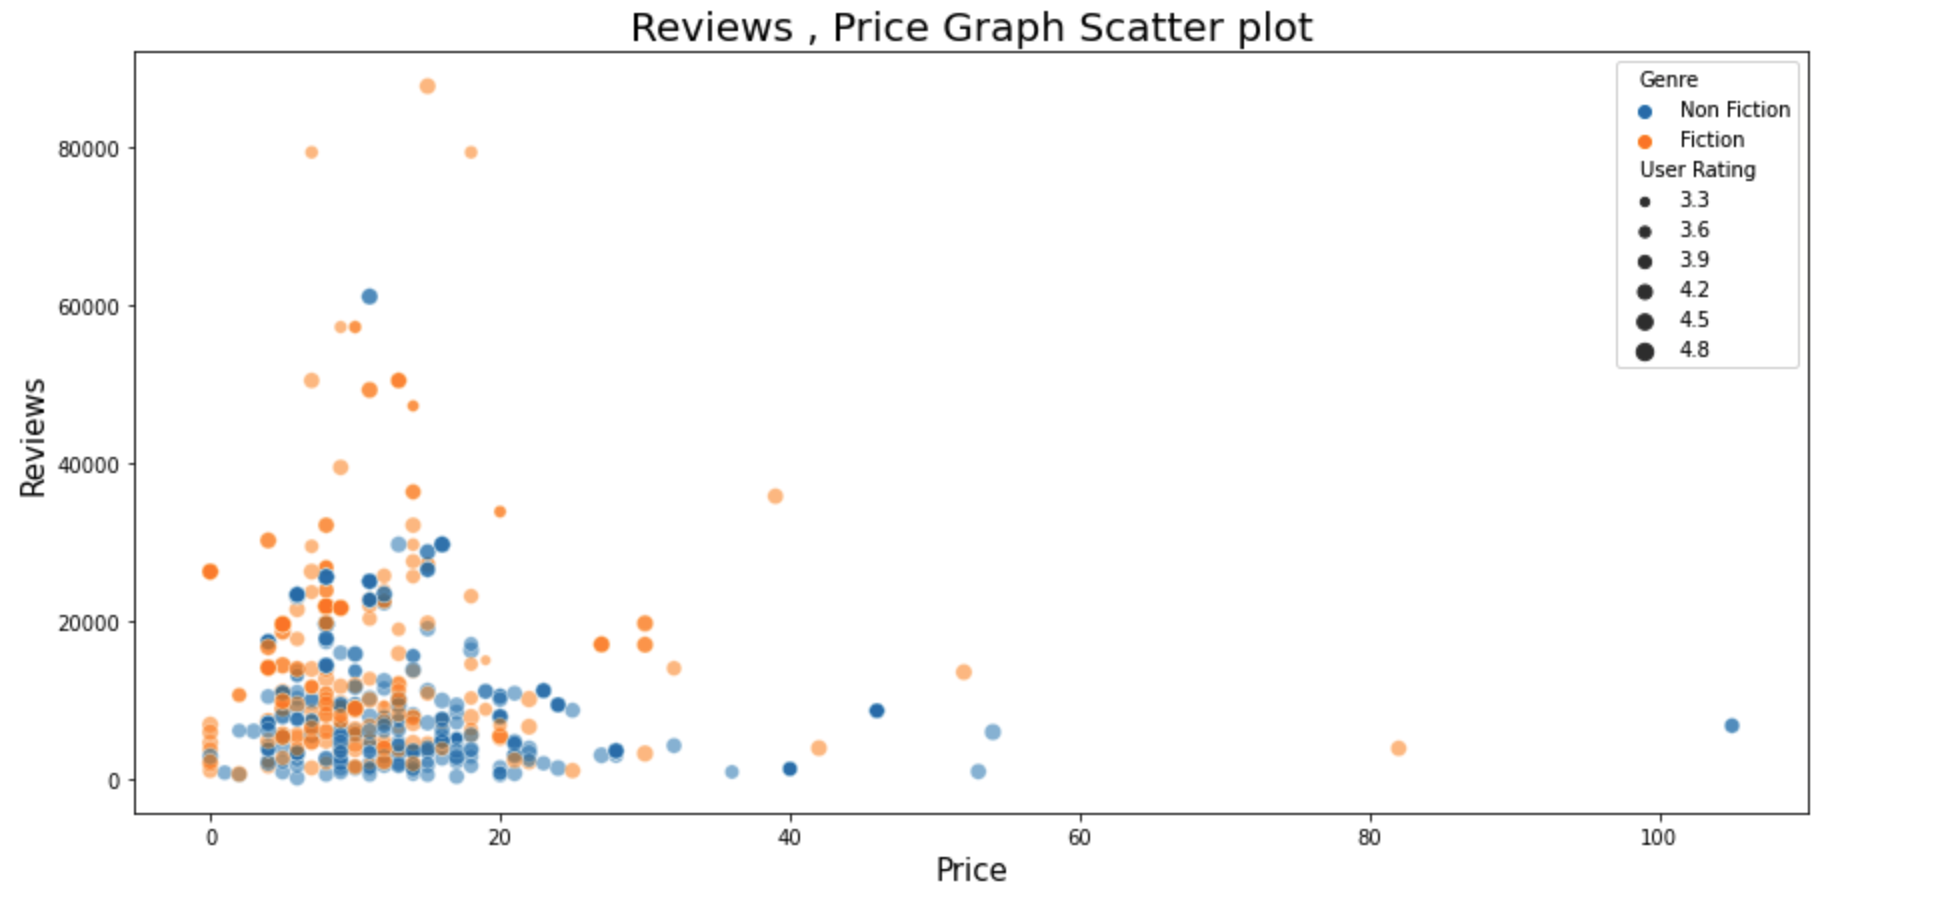
이차원 커널 밀도 함수를 그리는 것과 같이 x, y, 모두 연속적인 속성을 입력합니다. 게다가 sns.scatterplot에는 size 인자가 있어서 연속적인 속성을 하나 더 설정함으로써 각 점의 크기를 해당 속성의 수치를 기반으로 정할 수 있습니다.
A step-by-step guide for creating advanced Python data visualizations with Seaborn / Matplotlib
Although there’re tons of cool visualization tools in Python, Matplotlib + Seaborn still stands out for its capability to create and…
towardsdatascience.com
'Python' 카테고리의 다른 글
| Python - Plotly를 이용해서 데이터 시각화하는 방법 (0) | 2020.11.06 |
|---|---|
| Python - Seaborn을 이용해서 Heatmap을 그려보기 (0) | 2020.11.05 |
| Python - Matplotlib을 이용해서 데이터 시각화 하는 방법 (0) | 2020.11.05 |
| Python - 기존 그래프의 확대 부분 같이 그리기 (1) | 2020.11.01 |
| Python - Seaborn 을 이용한 Boxplot , Violinplot 그리기 (0) | 2020.11.01 |